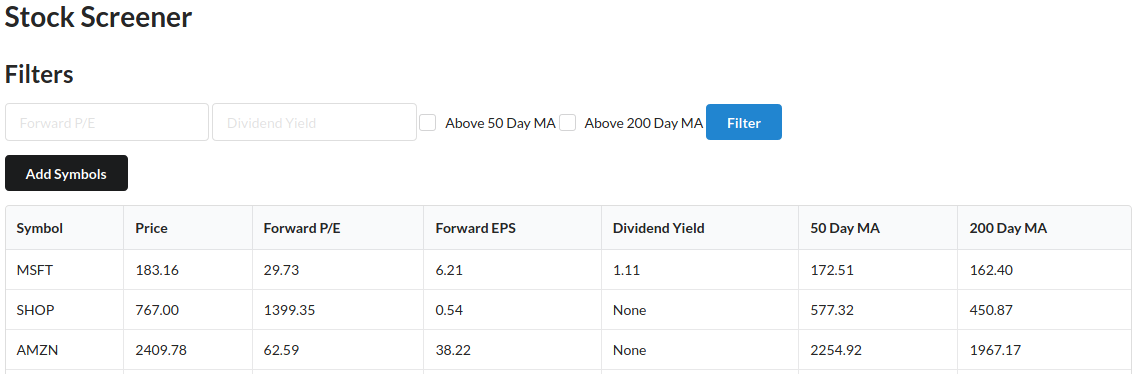
A stock screener that extracts data from the yfinance API to a SQLAlchemy database. Deploys data to a dashboard utilizing FastAPI with background tasks. Dashboard was built using Semantic UI. Users interactively sort and filter stock related data by: closing price, 50 day moving average, 200 day moving average, foward price to earnings ratio, forward earnings per share ratio, and dividend yield.
Feature Definitions
Closing Price: The price of a security at the end of the day’s business in a financial market.
Moving Average: A succession of averages derived from successive segments (typically of constant size and overlapping) of a series of values.
Forward P/E Ratio: Divides the current share price of a company by the estimated future (“forward”) earnings per share (EPS).
Forward EPS Ratio: Calculated as a company’s profit divided by the outstanding shares of its common stock. The resulting number serves as an indicator
of a company’s profitability.
Dividend Yield: Expressed as a percentage, it is a financial ratio that shows how much a company pay out in dividends each year relative to its stock price.
The reciprocal of the dividend yield is the dividend payout ratio. The dividend payout ratio is the ratio of the total amount of dividends paid out to shareholders
relative to the net income of the company.
Key Takeaways
Moving Average
A moving average is a widely used technical indicator that smooths out price trends by filtering out the “noise” from random short-term price fluctuations. Moving averages can be constructed in several different ways, and employ different numbers of days for the averaging interval.
Forward P/E Ratio
Analysts like to think of the P/E ratio as a price tag on earnings. It is used to calculate a relative value based on a company’s level of earnings. In theory, $1 of earnings at company A is worth the same as $1 of earnings at company B. If this is the case, both companies should also be trading at the same price, but this is rarely the case.
If company A is trading for $5 and company B is trading for $10, it means the market values company B’s earnings more. There can be various interpretations as to why company B is valued more. It could mean that company B’s earnings are overvalued. It could also mean that company B deserves a premium on the value of its earnings due to superior management and a better business model.

Forward EPS Ratio
Earnings per share (EPS) is a company’s net profit divided by the number of common shares it has outstanding. EPS indicates how much money a company makes for each share of its stock and is widely used metric for corporate profits. A higher EPS indicates more value because investors will pay more for a company with higher profits. EPS can be arrived at in several forms, such as excluding extraordinary items or discounted operations, or on a diluted basis.

Dividend Yield
The dividend yield-displayed as a percentage - is the amount of money a company pays shareholders for owning a share of its stock divided by its current stock price. Mature companies are the most likely to pay dividends. Companies in the utility and consumer staple industries often having higher dividend yields.
Real estate investment trusts (REITs), master limited partnerships (MLPs), and business development companies (BDCs) pay higher than average dividends; however, the dividends from these companies are taxed at a higher rate.
It’s important for investors to keep in mind that higher dividend yields do not always indicate attractive investment opportunities because the dividend yield of a stock may be elevated as the result of a declining stock price.
