During COVID and an impending hurricane, I found myself going down a rabbit-hole about the Naive Bayes Algorithm. I was particualary drawn to it because of its utility, the ability to calculate the likelihood of an event to occur. When I came across the UCI data set for student performance, I knew that I would be able to identify a problem that I could solve with the Naive Bayes Algorithm. I could have imported a libray, created a pipeline, and input the values, but that would have been too easy and I would have missed out on the opportunity to understand how the Naive Bayes Algorithm is engineered.
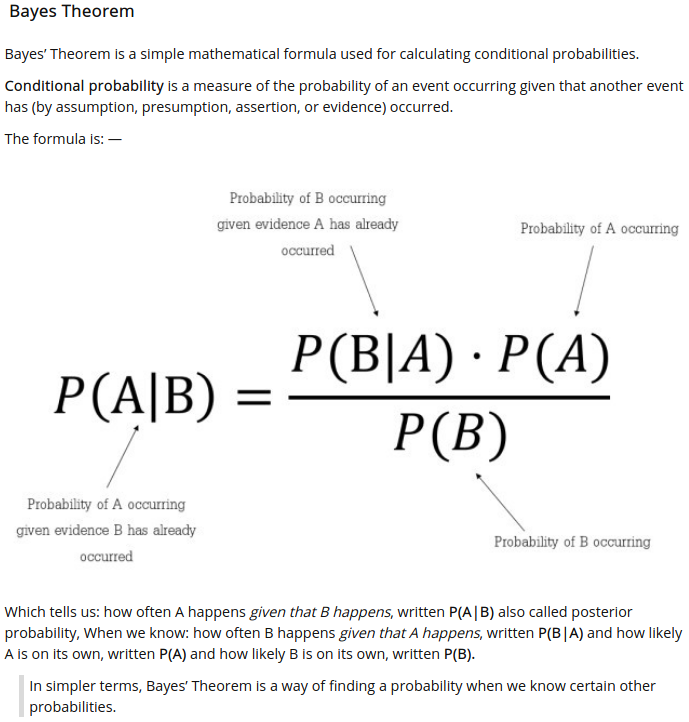
Naive Bayes is a probabilistic machine learning algorithm based on Bayes Theorem, which is primarily used for classification problems.
Breakdown of Code
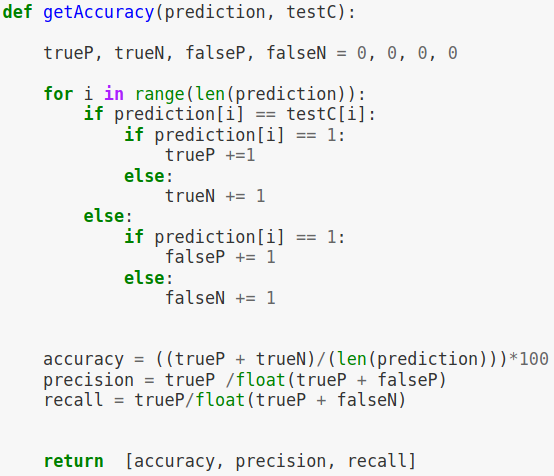
After studying the Naive Bayes Algorithm, I was able to identify the necessary methods needed to construct it: splitting the dataset, calculating the mean and variance, making predictions, and getting the accuracy.
Splitting the Dataset
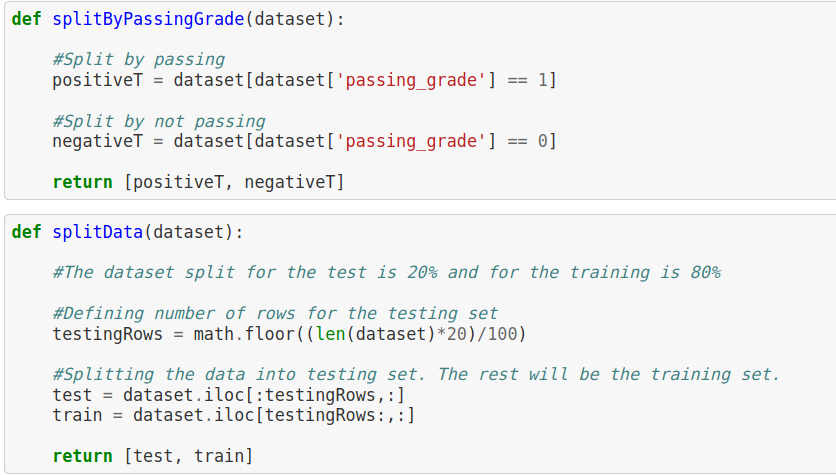
A necessary function to split the data set into a training and testing. The training set is the set used to train the algo and store the results to be tested on the test portion of the dataset with a 80/20 split.
Splitting by class was essential to the algorithm to identify successful and unsuccessful targets. By identifying the passing grade with a 1 and a not passing grade with a 0, we were able to identify positive and negative results in the algo.
Calculating the Mean and Variance
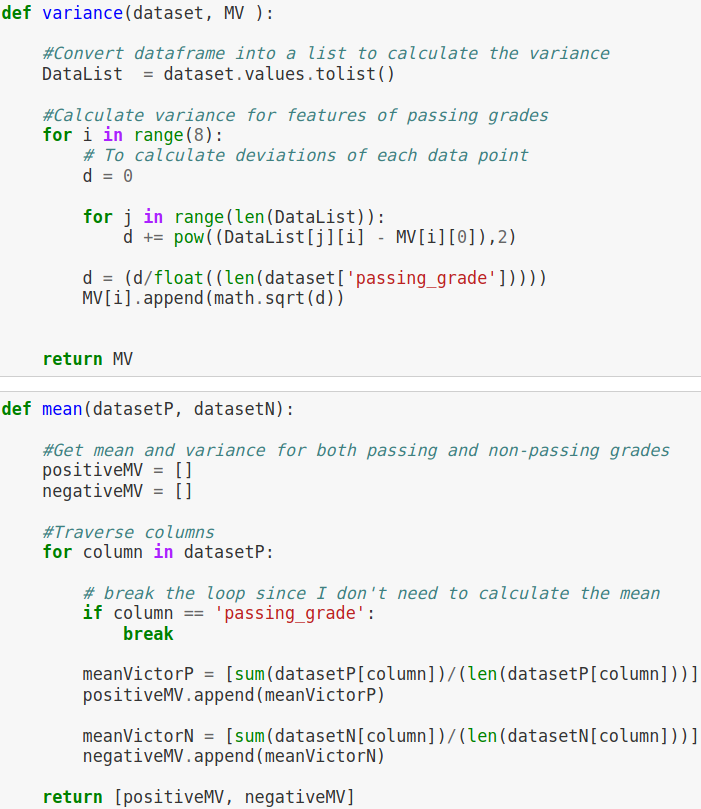
Two essential statistics for the Naive Bayes Algorithm, mean and variance. By creating a loop to traverse the columns, the algo was able to establish and store both the mean and variance for both passing and not passing grades in the dataset.
In lehman’s terms the mean is defined as the sum of values divided by how many values you have. Variance is calculated by taking the differences between each number in the data set and the mean, then squaring the differences to make them positive, and finally dividing the sum of the squares by the number of values in the data set.
Visual Representation of Variance:

A tree traversal was decided so the algorithm visits each node only once, in order in the data structure. The traversal is classified by the order in which the nodes are visited.
Making Predictions
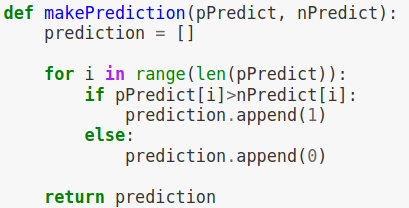
Probabilities are calculated separately for each class. This means that we first calculated the probability that a new piece of data belongs to the first class, then calculates the probabilities that it belongs to the second class and then stores it in a dictionary.
Get Accuracy
Modeling
After loading in the dataset, the categorical features were dropped from the dataset. The next step was to establish which grades were considered passing (greater then or equal to 70%) and not passing (less then 70%), then identifying which student was passing their course with a 1 for passing and a 0 for not passing. An initial probability was calculated to establish a baseline to compare our results. By simply identifying the percentage of students who passed, the baseline is established at 71%.

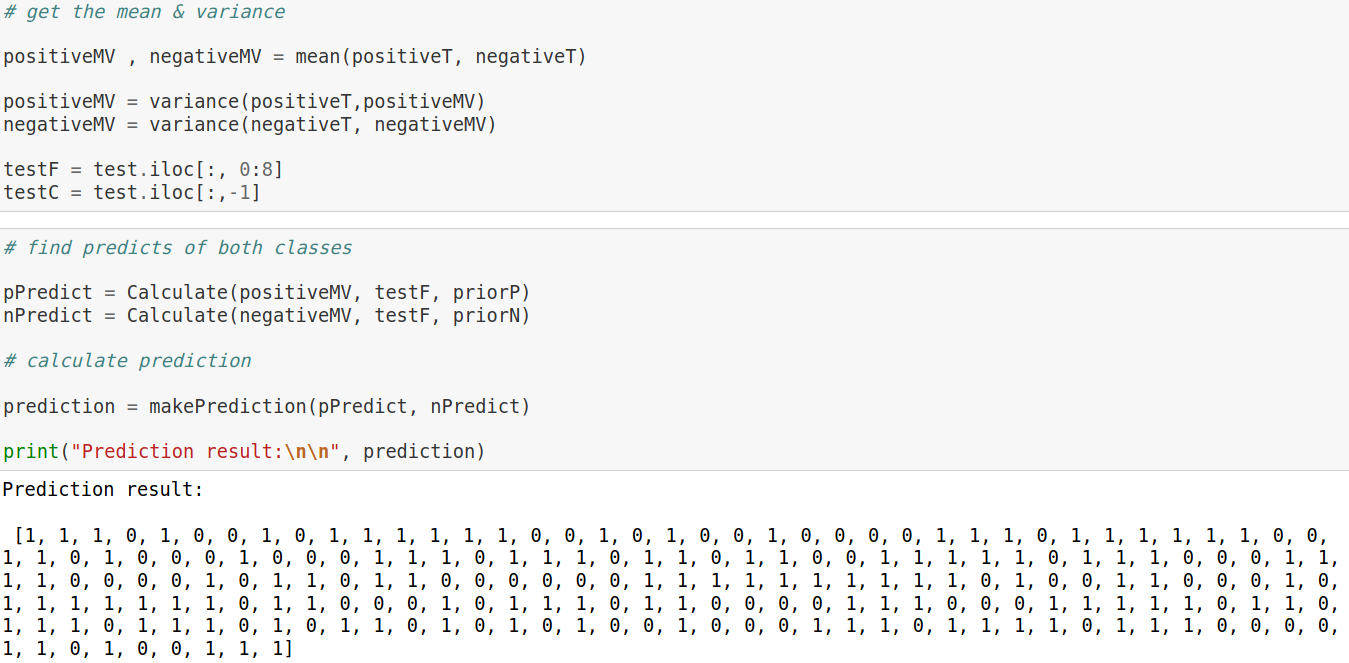
The next step, was to implement the calculate mean and variance method for each class (passing and not-passing grades). Next, was to calculate the predictions and then utilize the get accuracy method to determine the… accuracy of the model.
Conclusion
With an accuracy score of 56%, the model performed 14.92 basis points below the establish baseline of 71%. The major factor that contributed to this result was from dropping the features with cardinality. Identified in the exploratory data analysis, these features were initially dropped for the simplicty of understanding the algorithm without the additional steps required for categorical encoding. Because the categorical features were not included, the accuracy score of the model was recorded below the established baseline.

Overall, this has been a great way to learn how the Naive Bayes Algorithm is engineered and why it is utilized so often.
